Oracle Database Architecture


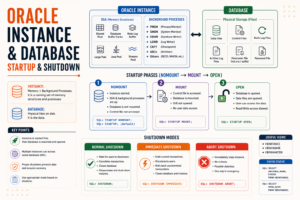
Learn Oracle Database Architecture with a simple visual guide covering Instance, SGA, Background Processes, Database Files, and Storage.
A complete production-ready SOP covering Oracle Database architecture from the ground up. Covers physical and logical storage structures, Oracle instance components, SGA and its sub-components, PGA, background processes, connection models, memory management, redo and undo internals, and how everything works together — with real commands, diagnostic queries, and consultant-level notes that connect architecture to real-world DBA activities.
1. Document Info
| Item | Detail |
|---|---|
| Oracle Version | 19c (19.3+) |
| OS | Oracle Linux 7.x / RHEL 7.x or 8.x |
| Purpose | Foundation knowledge for all DBA activities |
| MOS Reference | Doc ID 1523319.1 (Oracle Architecture Overview) |
| MOS Reference | Doc ID 430473.1 (SGA and Memory Management) |
| MOS Reference | Doc ID 1549180.1 (Background Processes Reference) |
| Prepared By | W3Buddy |
2. The Big Picture — What is an Oracle Database?
📝 Most people confuse Oracle Instance with Oracle Database. These are two completely separate things and understanding the difference is the most fundamental concept in Oracle architecture.
Oracle Instance vs Oracle Database
| Oracle Instance | Oracle Database | |
|---|---|---|
| What it is | Memory structures + Background processes running in RAM | Physical files stored on disk |
| Lives in | Server RAM | Server disk / storage |
| Can exist without the other? | Yes — instance can run without a mounted database | Yes — database files can exist without a running instance |
| Multiple instances per DB? | Yes — RAC has one database with multiple instances | One database accessed by multiple instances in RAC |
| When you start the DB | You start the INSTANCE which then opens the DATABASE | — |
ONE DATABASE, ONE INSTANCE (Standalone)
──────────────────────────────────────
SERVER RAM                    SERVER DISK
┌─────────────────┐           ┌──────────────────────┐
│  ORACLE         │           │  ORACLE DATABASE      │
│  INSTANCE       │◄─────────►│                       │
│                 │  mounts   │  ● Datafiles          │
│  ● SGA          │  and      │  ● Control Files      │
│  ● Background   │  opens    │  ● Redo Log Files     │
│    Processes    │           │  ● Archive Log Files  │
│  ● PGA          │           │  ● Parameter File     │
│                 │           │  ● Password File      │
└─────────────────┘           └──────────────────────┘

ONE DATABASE, MULTIPLE INSTANCES (RAC)
──────────────────────────────────────
NODE 1 RAM          NODE 2 RAM          SHARED DISK
┌───────────┐       ┌───────────┐       ┌───────────────┐
│ INSTANCE 1│       │ INSTANCE 2│       │ ONE DATABASE  │
│ (RACDB1)  │◄─────►│ (RACDB2)  │◄─────►│               │
│ SGA + BGP │       │ SGA + BGP │       │ ● Datafiles   │
└───────────┘       └───────────┘       │ ● Controlfile │
                                        │ ● Redo Logs   │
                                        └───────────────┘
Check Instance vs Database
sqlplus / as sysdba

set linesize 200
set pagesize 50

-- Shows INSTANCE information (what is in memory)
col instance_name  for a15
col host_name      for a25
col version        for a15
col status         for a12
col startup_time   for a25

SELECT instance_name,
       host_name,
       version_full,
       status,
       TO_CHAR(startup_time,'YYYY-MM-DD HH24:MI:SS') startup_time
FROM   v$instance;

-- Shows DATABASE information (what is on disk)
col name           for a12
col db_unique_name for a20
col open_mode      for a15
col log_mode       for a15
col database_role  for a20

SELECT name,
       db_unique_name,
       open_mode,
       log_mode,
       database_role,
       created
FROM   v$database;
3. Physical Database Structures (Files on Disk)
📝 Physical structures are the actual files Oracle creates and manages on disk. Without these files — there is no database.
3.1 — Datafiles
📝 What are datafiles? Datafiles are the actual files that store all the data — tables, indexes, PL/SQL code, views, sequences, everything. Each tablespace is made up of one or more datafiles.
📝 Why does this matter for DBA work? When a datafile runs out of space, tables cannot grow and inserts fail with
ORA-01653. When a datafile is accidentally deleted, that tablespace goes offline and applications fail. Every space management task, every backup, and every recovery starts with knowing your datafiles.
-- List all datafiles with sizes and status
set linesize 200
set pagesize 100
col file#           for 999
col tablespace_name for a25
col status          for a12
col autoextensible  for a5
col size_mb         for 99999999
col maxsize_mb      for 99999999
col name            for a70

SELECT f.file#,
       t.name                          tablespace_name,
       f.status,
       ROUND(f.bytes/1024/1024,2)      size_mb,
       f.autoextensible,
       ROUND(f.maxbytes/1024/1024,2)   maxsize_mb,
       f.name
FROM   v$datafile  f,
       v$tablespace t
WHERE  f.ts# = t.ts#
ORDER BY t.name, f.file#;
3.2 — Control Files
📝 What is the control file? The control file is the most critical file in an Oracle database. It contains:
- Database name and DBID
- Timestamp of database creation
- List of all datafiles and their locations
- List of all redo log files and their locations
- Current redo log sequence number
- Checkpoint information
- RMAN backup information (when no catalog is used)
Oracle reads the control file at database startup to find all other files. If all copies of the control file are lost and there is no backup — the database cannot be opened.
📝 Why multiple control files? Oracle strongly recommends multiplexing (having multiple copies of) the control file on different disks. If one disk fails, the other copies protect you. Always have at least 2, preferably 3 control files on different storage locations.
-- List all control files
set linesize 200
set pagesize 50
col status for a10
col name   for a80

SELECT status, name
FROM   v$controlfile
ORDER BY name;

-- Check control file record section sizes
set linesize 200
set pagesize 100
col type           for a30
col records_total  for 9999999
col records_used   for 9999999

SELECT type, records_total, records_used
FROM   v$controlfile_record_section
ORDER BY type;

-- How many control file copies are configured
SHOW PARAMETER control_files;
3.3 — Online Redo Log Files
📝 What are online redo logs? Redo logs record every change made to the database — every INSERT, UPDATE, DELETE, and DDL operation is written to the redo log BEFORE it is written to the datafile. This is the cornerstone of Oracle’s crash recovery mechanism.
📝 Why do redo logs matter for DBA work?
- Too small = frequent log switches = performance impact on commits (
log file syncwait event)- Too few groups = archiver cannot keep up = database hangs (
log switch/archiving neededwait)- If current redo log is corrupted = database cannot open without incomplete recovery
- Redo logs are the foundation of Data Guard — the standby applies these logs
📝 How does Oracle use redo logs? Oracle writes to redo log groups in circular fashion. It writes to Group 1, fills it, switches to Group 2, fills it, switches to Group 3, then back to Group 1. Before reusing a group, it must be archived (in ARCHIVELOG mode). The LGWR background process writes redo.
-- Check online redo log groups and members
set linesize 200
set pagesize 100
col l#      for 999
col status  for a12
col members for 999
col member  for a70

SELECT l.group#  l#,
       l.members,
       l.bytes/1024/1024  size_mb,
       l.status,
       l.archived,
       l.sequence#,
       f.member
FROM   v$log     l,
       v$logfile f
WHERE  l.group# = f.group#
ORDER BY l.group#, f.member;

-- Check which group is currently being written to
SELECT group#, status FROM v$log WHERE status = 'CURRENT';
3.4 — Archive Log Files
📝 What are archive logs? When Oracle finishes writing to a redo log group and switches to the next group, it copies the completed redo log to the archive log destination. This copy is called an archivelog. Archive logs allow recovery to any point in time — you restore the datafiles from backup and then apply all the archive logs created after that backup.
📝 Archive logs are the bridge between backups. Without archive logs you can only recover to the last backup point. With archive logs you can recover to any point between backups — even to one second before a disaster.
-- Check archive log mode and destination
ARCHIVE LOG LIST;

-- List recent archive logs
set linesize 200
set pagesize 100
col name           for a70
col sequence#      for 9999999
col first_time     for a25
col completion_time for a25
col archived       for a10

SELECT sequence#,
       name,
       TO_CHAR(first_time,'YYYY-MM-DD HH24:MI:SS')      first_time,
       TO_CHAR(completion_time,'YYYY-MM-DD HH24:MI:SS')  completion_time,
       blocks * block_size / 1024 / 1024                 size_mb
FROM   v$archived_log
WHERE  completion_time > SYSDATE - 1
ORDER BY sequence# DESC
FETCH FIRST 20 ROWS ONLY;

-- Check archive destination status
set linesize 200
set pagesize 50
col dest_name  for a25
col status     for a12
col target     for a12
col destination for a50

SELECT dest_id, dest_name, status, target, destination
FROM   v$archive_dest
WHERE  status != 'INACTIVE'
ORDER BY dest_id;
3.5 — Parameter File (spfile / pfile)
📝 What is the parameter file? The parameter file contains initialization parameters that control how Oracle starts and behaves — memory sizes, number of processes, file locations, feature settings. Oracle reads it at instance startup.
📝 spfile vs pfile:
spfile(Server Parameter File) — binary file managed by Oracle. Changes made withALTER SYSTEMare written directly to spfile. This is the production standard.pfile(init.ora) — plain text file. Must be manually edited. Oracle cannot update it automatically. Used for emergencies and special startup scenarios.
-- Check if using spfile or pfile
SELECT decode(value,NULL,'PFILE','SPFILE') parameter_file_type,
       value                               spfile_location
FROM   v$parameter
WHERE  name = 'spfile';

-- Show spfile location
SHOW PARAMETER spfile;

-- List all non-default parameters (what you have customized)
set linesize 200
set pagesize 100
col name        for a45
col value       for a50
col description for a60

SELECT name, value, description
FROM   v$parameter
WHERE  isdefault = 'FALSE'
ORDER BY name;
# View pfile/spfile content (as oracle OS user)
# spfile is binary -- cannot cat it
# Create a pfile from spfile to read it
sqlplus / as sysdba-- Create a readable pfile from spfile
CREATE PFILE='/tmp/init_ORCL_readable.ora' FROM SPFILE;
EXIT;cat /tmp/init_ORCL_readable.ora3.6 — Password File
📝 What is the password file? The password file stores the encrypted password for the SYS user (and other users granted SYSDBA/SYSOPER privileges). It allows remote SYSDBA connections — for example
sqlplus sys/password@ORCL as sysdbaover the network. Without the password file, SYSDBA login only works locally via OS authentication.
📝 Why does this matter for DBA work? Data Guard requires password files because the standby must authenticate with the primary over the network as SYS. RMAN duplicate requires it. OEM agent uses it. If the password file is missing or mismatched, these features break.
# Check password file location (Convention A)
ls -lh $ORACLE_HOME/dbs/orapw${ORACLE_SID}

# Convention B
ls -lh $ORACLE_HOME/dbs/orapwORCL

# List users who have SYSDBA or SYSOPER privilege
# (these users are in the password file)
set linesize 150
set pagesize 50
col username for a25
col sysdba for a8
col sysoper for a8
col sysbackup for a10
col sysdg for a8
SELECT username, sysdba, sysoper, sysbackup, sysdg
FROM v$pwfile_users
ORDER BY username;4. Logical Database Structures
📝 Logical structures are how Oracle organizes data internally — they are not individual files on disk but rather Oracle’s way of grouping and managing storage.
4.1 — The Logical Storage Hierarchy
DATABASE
    │
    ├── TABLESPACE (logical grouping)
    │       │
    │       ├── SEGMENT (one object = one or more segments)
    │       │       │
    │       │       ├── EXTENT (contiguous set of blocks)
    │       │       │       │
    │       │       │       └── ORACLE BLOCK (smallest unit — 8KB default)
    │       │       │
    │       │       └── EXTENT
    │       │
    │       └── SEGMENT
    │
    └── TABLESPACE
            │
            └── maps to physical DATAFILE(s) on disk
📝 Key relationships:
- 1 Database → Many Tablespaces
- 1 Tablespace → Many Datafiles + Many Segments
- 1 Segment → Many Extents (segments grow by adding extents)
- 1 Extent → Many Oracle Blocks (contiguous)
- Oracle Block → smallest I/O unit (default 8KB)
4.2 — Tablespaces
📝 What is a tablespace? A tablespace is a logical storage container. It maps to one or more physical datafiles on disk. Every database object (table, index, etc.) belongs to exactly one tablespace.
Default tablespaces in a fresh Oracle 19c database:
| Tablespace | Purpose | Notes |
|---|---|---|
| SYSTEM | Oracle data dictionary — tables, views, packages owned by SYS | Never store application data here |
| SYSAUX | Auxiliary to SYSTEM — AWR, Statspack, OEM repository | Never store application data here |
| USERS | Default tablespace for user objects | General purpose |
| UNDOTBS1 | Undo segments — stores before-images for rollback and read consistency | Managed automatically |
| TEMP | Temporary segments for sort operations, hash joins | Shared across sessions |
-- Complete tablespace overview
set linesize 200
set pagesize 100
col tablespace_name for a25
col contents        for a12
col status          for a10
col total_mb        for 9999999
col free_mb         for 9999999
col used_pct        for 999.99
col autoextend      for a5

SELECT df.tablespace_name,
       t.contents,
       t.status,
       ROUND(df.total_bytes/1024/1024,2)                    total_mb,
       ROUND(NVL(fs.free_bytes,0)/1024/1024,2)              free_mb,
       ROUND((1-NVL(fs.free_bytes,0)/df.total_bytes)*100,2) used_pct,
       df.autoextend
FROM  (SELECT tablespace_name,
              SUM(bytes)    total_bytes,
              MAX(DECODE(autoextensible,'YES','YES','NO')) autoextend
       FROM   dba_data_files
       GROUP BY tablespace_name) df,
      (SELECT tablespace_name,
              SUM(bytes) free_bytes
       FROM   dba_free_space
       GROUP BY tablespace_name) fs,
       dba_tablespaces t
WHERE  df.tablespace_name = fs.tablespace_name(+)
AND    df.tablespace_name = t.tablespace_name
ORDER BY used_pct DESC;
4.3 — Segments, Extents, and Blocks
-- Check segment sizes for a specific schema
set linesize 200
set pagesize 100
col owner        for a20
col segment_name for a35
col segment_type for a20
col tablespace_name for a20
col size_mb      for 99999999

SELECT owner,
       segment_name,
       segment_type,
       tablespace_name,
       ROUND(bytes/1024/1024,2) size_mb,
       extents,
       blocks
FROM   dba_segments
WHERE  owner = 'HR'
ORDER BY bytes DESC
FETCH FIRST 20 ROWS ONLY;

-- Check block size
SHOW PARAMETER db_block_size;

-- Check extent management mode
set linesize 200
set pagesize 50
col tablespace_name   for a25
col extent_management for a20
col allocation_type   for a15
col segment_space_management for a25

SELECT tablespace_name,
       extent_management,
       allocation_type,
       segment_space_management
FROM   dba_tablespaces
ORDER BY tablespace_name;
5. Oracle Instance — Memory Structures
📝 The Oracle Instance consists of memory (SGA + PGA) and background processes. When you start an Oracle instance, Oracle allocates a large chunk of RAM for the SGA and starts multiple background processes.
5.1 — SGA — System Global Area
📝 What is the SGA? The SGA (System Global Area) is a shared memory region allocated when the Oracle instance starts. ALL sessions connected to the instance share the SGA. It is the single largest consumer of RAM on an Oracle database server.
📝 Why is SGA critical? The bigger the SGA (specifically the buffer cache), the more data Oracle can keep in memory and the fewer disk reads are needed. Disk reads are 1000x slower than memory reads. Proper SGA sizing is one of the most impactful performance tuning actions.
-- Overall SGA summary
set linesize 200
set pagesize 50
col name       for a30
col value_mb   for 9999999.99

SELECT name,
       ROUND(value/1024/1024,2) value_mb
FROM   v$sga
ORDER BY value DESC;

-- Detailed SGA component breakdown
set linesize 200
set pagesize 100
col component    for a40
col current_mb   for 9999999
col min_mb       for 9999999
col max_mb       for 9999999

SELECT component,
       ROUND(current_size/1024/1024,0)  current_mb,
       ROUND(min_size/1024/1024,0)       min_mb,
       ROUND(max_size/1024/1024,0)       max_mb
FROM   v$sga_dynamic_components
WHERE  current_size > 0
ORDER BY current_size DESC;
5.2 — SGA Components in Detail
SGA (System Global Area)
├── Buffer Cache          ← Cached datafile blocks (largest component)
├── Shared Pool           ← SQL cache, data dictionary cache, PL/SQL code
│   ├── Library Cache     ← Parsed SQL statements, execution plans, PL/SQL code
│   └── Dictionary Cache  ← Metadata about tables, columns, indexes, users
├── Redo Log Buffer       ← Recent redo entries before LGWR writes to disk
├── Large Pool            ← Used by RMAN, shared server, parallel query
├── Java Pool             ← Java Virtual Machine memory (if Java used)
├── Streams Pool          ← GoldenGate, Advanced Queuing, Streams
└── Fixed SGA             ← Internal Oracle overhead (small, fixed size)
5.3 — Buffer Cache
📝 What is the Buffer Cache? The Buffer Cache is a pool of memory that holds copies of Oracle data blocks read from datafiles. When a session needs a block, Oracle first checks the buffer cache (logical read). If found — great, no disk I/O needed. If not found (cache miss), Oracle reads the block from disk into the cache (physical read).
📝 Buffer Cache replacement algorithm: Oracle uses a modified LRU (Least Recently Used) algorithm called the “touch count” mechanism. Recently and frequently accessed blocks stay at the hot end of the LRU list. Infrequently accessed blocks migrate to the cold end and are eligible for replacement.
-- Buffer cache hit ratio
-- Formula: 1 - (physical reads / (consistent gets + db block gets))
-- Target: > 95%  (higher is better -- means more reads from cache)
set linesize 150
set pagesize 50

SELECT ROUND(
    (1 - (phy.value / NULLIF(con.value + cur.value, 0))) * 100, 2
) buffer_cache_hit_pct
FROM   v$sysstat phy,
       v$sysstat con,
       v$sysstat cur
WHERE  phy.name = 'physical reads'
AND    con.name = 'consistent gets'
AND    cur.name = 'db block gets';

-- Buffer cache size and advisory
set linesize 200
set pagesize 100
col size_mb            for 9999999
col estd_physical_reads for 9999999999
col estd_pct_of_base   for 999.99

SELECT size_for_estimate/1024/1024                 size_mb,
       estd_physical_reads,
       ROUND(estd_physical_read_factor*100,2)       estd_pct_of_base
FROM   v$db_cache_advice
WHERE  name       = 'DEFAULT'
AND    block_size = (SELECT TO_NUMBER(value)
                     FROM   v$parameter
                     WHERE  name = 'db_block_size')
ORDER BY size_for_estimate;
5.4 — Shared Pool
📝 What is the Shared Pool? The Shared Pool caches parsed SQL statements, execution plans, PL/SQL compiled code, and data dictionary information. Its purpose is to avoid redundant parsing work.
📝 Library Cache — SQL caching explained: When a SQL statement is first executed, Oracle parses it (syntax check, semantic check, optimization, plan generation) — called a Hard Parse. This is expensive. If the SAME statement is executed again, Oracle finds it in the Library Cache and reuses the plan — called a Soft Parse. Much cheaper.
📝 The bind variable connection: For the Library Cache to reuse a plan, the SQL text must match EXACTLY.
SELECT * FROM emp WHERE id = 100andSELECT * FROM emp WHERE id = 101are TWO DIFFERENT statements and both need a hard parse. ButSELECT * FROM emp WHERE id = :idwith different bind variable values uses ONE cached plan. This is why bind variables are critical for performance.
-- Library cache hit ratio
-- Target: > 99%
set linesize 150
set pagesize 50

SELECT namespace,
       ROUND(gethitratio*100,2)  get_hit_pct,
       ROUND(pinhitratio*100,2)  pin_hit_pct,
       reloads,
       invalidations
FROM   v$librarycache
WHERE  namespace IN ('SQL AREA','TABLE/PROCEDURE','BODY','TRIGGER')
ORDER BY namespace;

-- Dictionary cache hit ratio
-- Target: > 95%
set linesize 150
set pagesize 50

SELECT ROUND(
    (1 - SUM(getmisses) / NULLIF(SUM(gets), 0)) * 100, 2
) dict_cache_hit_pct
FROM   v$rowcache;

-- Shared pool free memory
set linesize 150
set pagesize 50

SELECT name,
       ROUND(bytes/1024/1024,2) free_mb
FROM   v$sgastat
WHERE  pool = 'shared pool'
AND    name = 'free memory';

-- Hard parse rate (should be low)
set linesize 150
set pagesize 50

SELECT s1.value                                         total_parses,
       s2.value                                         hard_parses,
       ROUND(s2.value*100/NULLIF(s1.value,0),2)         hard_parse_pct
FROM   v$sysstat s1,
       v$sysstat s2
WHERE  s1.name = 'parse count (total)'
AND    s2.name = 'parse count (hard)';
5.5 — Redo Log Buffer
📝 What is the Redo Log Buffer? The Redo Log Buffer is a circular buffer in the SGA where Oracle temporarily stores redo entries before the LGWR background process writes them to the online redo log files on disk. It is small (default 3-15 MB) compared to the buffer cache.
📝 How commits work with the redo log buffer:
- Session makes a change (INSERT, UPDATE, DELETE)
- Redo entry describing the change is written to Redo Log Buffer
- Session issues COMMIT
- LGWR immediately flushes all redo for this transaction from buffer to redo log file on disk
- COMMIT returns to the session ONLY AFTER LGWR confirms the write
- This ensures committed transactions are never lost even if the server crashes
-- Check redo log buffer size
SHOW PARAMETER log_buffer;

-- Check redo log buffer efficiency
-- "redo log space requests" should be near 0
-- If high -- redo log buffer is too small
set linesize 150
set pagesize 50

SELECT name, value
FROM   v$sysstat
WHERE  name IN (
    'redo log space requests',
    'redo buffer allocation retries',
    'redo writes',
    'redo size'
)
ORDER BY name;
5.6 — Large Pool
📝 What is the Large Pool? The Large Pool is optional memory used for:
- RMAN backup and restore operations (I/O server processes)
- Shared server architecture (UGA — User Global Area)
- Parallel query operations
- Oracle Advanced Queuing
Without a Large Pool, these operations steal memory from the Shared Pool causing shared pool fragmentation.
-- Check Large Pool size
SHOW PARAMETER large_pool_size;

-- Check Large Pool usage
SELECT name, ROUND(bytes/1024/1024,2) mb
FROM   v$sgastat
WHERE  pool = 'large pool'
ORDER BY bytes DESC;
5.7 — SGA Memory Management Modes
📝 Three memory management modes — know which one your environment uses:
| Mode | Parameters | How It Works |
|---|---|---|
| Manual SGA Management | Set each component individually (db_cache_size, shared_pool_size etc.) | DBA manually sizes each component. Most control but most work. |
| Automatic SGA Management (ASMM) | Set SGA_TARGET | Oracle automatically redistributes memory between components based on workload. Recommended for most environments. |
| Automatic Memory Management (AMM) | Set MEMORY_TARGET | Oracle manages BOTH SGA and PGA automatically. Not recommended for large databases — can cause paging. |
-- Check which mode is in use
set linesize 200
set pagesize 50
col name  for a30
col value for a20

SELECT name, value
FROM   v$parameter
WHERE  name IN (
    'memory_target',
    'memory_max_target',
    'sga_target',
    'sga_max_size',
    'pga_aggregate_target',
    'db_cache_size',
    'shared_pool_size'
)
ORDER BY name;

-- If memory_target > 0 = AMM mode
-- If sga_target > 0 and memory_target = 0 = ASMM mode
-- If both = 0 = Manual mode
6. PGA — Program Global Area
📝 What is PGA? PGA (Program Global Area) is private memory allocated for each individual server process (or each session in shared server mode). Unlike SGA which is shared between all sessions, PGA is private to each session. When the session disconnects, its PGA is freed.
📝 What is PGA used for?
- Sort operations (ORDER BY, GROUP BY, UNION)
- Hash join operations
- Bitmap merge operations
- Session variables and stack space
If a sort operation does not fit in PGA, Oracle writes to TEMP tablespace on disk — much slower. Properly sized PGA reduces temp tablespace writes and dramatically improves sort and join performance.
PGA (per session — private)
├── Sort Area          ← Memory for sort operations
├── Hash Area          ← Memory for hash join operations
├── Bitmap Merge Area  ← Memory for bitmap index operations
├── Session Variables  ← Bind variables, session state
└── Stack Space        ← Call stack for PL/SQL
-- Overall PGA usage and statistics
set linesize 200
set pagesize 100
col name for a45
col value for a25
SELECT name, value
FROM v$pgastat
WHERE name IN (
'aggregate PGA target parameter',
'aggregate PGA auto target',
'total PGA inuse',
'total PGA allocated',
'maximum PGA allocated',
'total freeable PGA memory',
'cache hit percentage',
'recompute count (total)'
)
ORDER BY name;
-- PGA sizing advisory
set linesize 200
set pagesize 100
col pga_target_mb for 9999999
col estd_pga_cache_hit_pct for 999.99
col estd_overalloc_cnt for 9999999
SELECT pga_target_for_estimate/1024/1024 pga_target_mb,
ROUND(estd_pga_cache_hit_pct,2) estd_pga_cache_hit_pct,
estd_overalloc_cnt
FROM v$pga_target_advice
ORDER BY pga_target_for_estimate;7. Oracle Background Processes
📝 What are background processes? Background processes are OS-level processes started by Oracle when the instance starts. They run continuously in the background handling specific tasks — writing data to disk, writing redo logs, cleaning up, archiving etc. You can see them in
ps -ef | grep ora_.
📝 Why must a DBA know background processes? When you see
ora_lgwr_ORCLin the process list, you know LGWR is running. When you see redo-related performance problems, you know to look at LGWR. When archiving stops, you look at ARCn. When data is not being written to disk, you look at DBWn. Background processes are the engine room of Oracle.
7.1 — Mandatory Background Processes
📝 These processes MUST be running for the database to operate. If any of these die, the database shuts down.
| Process | Full Name | What It Does |
|---|---|---|
| PMON | Process Monitor | Cleans up after failed user processes — rolls back their transactions, frees locks, releases resources. Also registers the DB with listeners (dynamic registration). |
| SMON | System Monitor | Instance recovery after a crash — applies redo from online redo logs. Also coalesces free space in tablespaces and cleans up temporary segments. |
| DBWR (DBWn) | Database Writer | Writes dirty blocks (modified data blocks in buffer cache) to datafiles on disk. Multiple writers possible (DBW0, DBW1… DBW9, DBWa-DBWj). Triggered by checkpoints and buffer cache shortage. |
| LGWR | Log Writer | Writes redo entries from the Redo Log Buffer to online redo log files. Triggered by COMMIT, every 3 seconds, when buffer is 1/3 full, before DBWn writes. Critical for commit performance. |
| CKPT | Checkpoint | Updates the control file and datafile headers with checkpoint information. Also signals DBWn to write dirty blocks during checkpoints. |
| MMON | Manageability Monitor | Takes AWR snapshots, runs ADDM analysis, collects statistics for OEM. Runs every 60 minutes by default. |
| MMNL | Manageability Monitor Lite | Flushes ASH (Active Session History) from memory to AWR tables. Runs every 60 seconds. |
| RECO | Recoverer | Resolves distributed transactions that failed due to network problems. Handles two-phase commit recovery. |
7.2 — Optional Background Processes
📝 These run only when specific features are configured.
| Process | Feature | What It Does |
|---|---|---|
| ARCn (ARC0-ARC9) | ARCHIVELOG mode | Copies completed redo log groups to archive log destinations. Multiple ARCn processes run in parallel. |
| MRP0 | Data Guard Standby | Managed Recovery Process — applies archived logs on the physical standby database. |
| LSP0 | Data Guard Logical Standby | Log apply for logical standby — uses LogMiner to extract and apply SQL from redo. |
| LMS | RAC Cache Fusion | Global Cache Service — transfers blocks between RAC instances using the interconnect. Critical for RAC performance. |
| LMD | RAC Lock Manager | Manages global enqueue locks across RAC instances. |
| LMON | RAC Cluster Monitor | Manages reconfiguration when nodes join or leave the cluster. |
| Dnnn | Shared Server | Dispatcher processes for shared server architecture. |
| Snnn | Shared Server | Shared server processes that handle multiple client connections. |
| CJQ0 | DBMS_JOB / Scheduler | Job Queue Coordinator — spawns job queue slave processes to run scheduled jobs. |
| FBDA | Flashback Data Archive | Archives rows for Flashback Data Archive (Total Recall). |
| SMCO | Space Management | Proactive space management — preallocates extents, manages space pressure. |
| DMON | Data Guard Broker | Data Guard Monitor — runs when DG_BROKER_START=TRUE. Manages DG configuration. |
7.3 — Check Running Background Processes
# View all Oracle background processes for a specific SID
ps -ef | grep ora_.*_ORCL | grep -v grep | sort

# Count background processes
ps -ef | grep ora_.*_ORCL | grep -v grep | wc -l
-- Check background processes from inside Oracle
set linesize 200
set pagesize 100
col pname for a12
col program for a30
col status for a10
col pid for 9999
SELECT p.pid,
p.spid os_pid,
b.name pname,
b.description,
p.program
FROM v$process p,
v$bgprocess b
WHERE p.addr = b.paddr
AND b.paddr != '00'
ORDER BY b.name;7.4 — Understanding the Checkpoint Process
📝 What is a checkpoint? A checkpoint is a synchronization point between the buffer cache and the datafiles. During a checkpoint, Oracle writes all dirty blocks (modified blocks that have not yet been written to disk) from the buffer cache to the datafiles, then updates the control file and datafile headers with the checkpoint SCN.
📝 Why checkpoints matter:
- After a crash, Oracle only needs to apply redo from the last checkpoint forward — not from the beginning
- More frequent checkpoints = faster crash recovery but more I/O during normal operation
- Larger redo logs = less frequent checkpoints = less I/O but slower crash recovery
Checkpoint Mechanics:
─────────────────────
                    Last Checkpoint            Current
                        SCN                    SCN
REDO LOG: ──────────────┼──────────────────────┼
                        │                      │
                        │◄── Recovery needed ──►│
                        │    if instance crashes │
                        │    (apply this redo)  │
                        │
                    Checkpoint writes:
                    - Dirty blocks → Datafiles
                    - Checkpoint SCN → Control file headers
                    - Checkpoint SCN → Datafile headers
-- Check checkpoint frequency
set linesize 200
set pagesize 50
SELECT name, value
FROM v$sysstat
WHERE name IN (
'background checkpoints completed',
'background checkpoints started'
)
ORDER BY name;
-- Current checkpoint SCN
SELECT checkpoint_change#
FROM v$database;
-- Checkpoint lag per datafile
set linesize 200
set pagesize 100
col file# for 999
col name for a60
col checkpoint_change# for 9999999999999
SELECT f.file#,
f.name,
f.checkpoint_change#
FROM v$datafile f
ORDER BY f.file#;8. How Oracle Processes a SQL Statement
📝 Understanding this flow is essential for performance tuning. Every SQL tuning activity (explain plans, SQL profiles, bind variables) makes sense once you understand how Oracle processes a statement.
8.1 — SQL Processing Steps
CLIENT sends SQL: SELECT * FROM hr.employees WHERE department_id = 10

STEP 1: PARSE
─────────────
  ├── Check Library Cache for matching SQL (SOFT PARSE if found)
  ├── Syntax Check (is the SQL grammatically correct?)
  ├── Semantic Check (do the tables and columns exist? does user have access?)
  ├── Security Check (does the user have SELECT privilege on employees?)
  └── HARD PARSE (if not in Library Cache):
      ├── Query Transformation (rewrites query if needed)
      ├── Statistics Check (are table/index stats available?)
      ├── Optimizer chooses best execution plan (CBO — Cost-Based Optimizer)
      └── Execution plan stored in Library Cache

STEP 2: BIND
─────────────
  └── If bind variables used (:dept_id), replace with actual values

STEP 3: EXECUTE
───────────────
  ├── For DML (INSERT/UPDATE/DELETE):
  │   ├── Lock required rows
  │   ├── Read current block from buffer cache (or disk if not cached)
  │   ├── Create undo record (before-image in UNDO segment)
  │   ├── Modify block in buffer cache (dirty block)
  │   └── Write redo entry to Redo Log Buffer
  │
  └── For SELECT:
      ├── Check buffer cache for needed blocks
      ├── Read missing blocks from datafiles into buffer cache
      └── Return rows to client

STEP 4: FETCH (SELECT only)
────────────────────────────
  └── Return rows to client in batches (arraysize)

STEP 5: COMMIT (DML only)
──────────────────────────
  ├── LGWR writes Redo Log Buffer to redo log file on disk
  ├── Commit SCN assigned
  ├── Locks released
  └── Dirty blocks remain in buffer cache (written to disk by DBWn later)
8.2 — Read Consistency — How Oracle Sees a Consistent Snapshot
📝 One of Oracle’s most important features: When you run a query, Oracle guarantees you see a consistent snapshot of the data as of the moment the query started — even if other sessions are modifying that data while your query runs. This is called Read Consistency and it is achieved using UNDO data.
📝 How it works: If your query starts at SCN 1000 and needs to read a block that has been modified by another session to SCN 1050, Oracle reads the current block then applies the UNDO records to reconstruct what the block looked like at SCN 1000. This is why:
ORA-01555: Snapshot too oldoccurs when UNDO data needed by your query has been overwritten- UNDO_RETENTION parameter controls how long undo data is kept
- Long-running queries need more undo data
-- Check current SCN (System Change Number)
-- Every commit gets a unique SCN -- Oracle's global clock
SELECT current_scn FROM v$database;

-- Check undo usage and ORA-01555 occurrences
set linesize 200
set pagesize 100
col begin_time    for a25
col maxquerylen   for 9999999
col ssolderrcnt   for 9999
col undoblks      for 9999999

SELECT TO_CHAR(begin_time,'YYYY-MM-DD HH24:MI') begin_time,
       maxquerylen,
       ssolderrcnt,    -- ORA-01555 snapshot too old errors
       undoblks
FROM   v$undostat
ORDER BY begin_time DESC
FETCH FIRST 10 ROWS ONLY;
9. Oracle Connection Models
📝 How do client applications actually connect to Oracle? There are three models and understanding them helps you size the database correctly and troubleshoot connection issues.
9.1 — Dedicated Server Connection (Default)
📝 How it works: Each client connection gets its own dedicated server process on the database server. The server process exists only for that one client and is destroyed when the client disconnects.
CLIENT PROCESS    ←──────────────────►    DEDICATED SERVER PROCESS
(on client machine)    TCP/IP network      (on database server)
                                           ● Only serves this one client
                                           ● Has its own PGA
                                           ● Lives until client disconnects
📝 Pros: Simple, no shared state issues, full PGA available.
Cons: 1000 clients = 1000 server processes = significant RAM and OS overhead.
Best for: Moderate number of long-lived connections (OLTP applications, ETL, batch).
9.2 — Shared Server Connection
📝 How it works: Multiple clients share a small pool of server processes. A Dispatcher process accepts client connections and queues requests. Server processes pick up requests from the queue, process them, and return results through the Dispatcher.
CLIENT 1 ──►┐
CLIENT 2 ──►├──► DISPATCHER ──► REQUEST QUEUE ──► SHARED SERVER 1
CLIENT 3 ──►│                                  ──► SHARED SERVER 2
CLIENT 4 ──►┘                                  ──► SHARED SERVER 3
                                           (small pool serves many clients)
📝 Pros: 1000 clients can share 20 server processes — huge memory saving.
Cons: More complex, UGA lives in Large Pool (not PGA), some restrictions on features.
Best for: Many short-lived connections (web applications).
-- Check if shared server is configured
SHOW PARAMETER shared_servers;
SHOW PARAMETER dispatchers;

-- Check active dispatchers
SELECT name, status, dispatched, circuit, idle, busy, created
FROM   v$dispatcher;

-- Check shared server processes
SELECT name, status, requests, idle, busy
FROM   v$shared_server;
9.3 — DRCP — Database Resident Connection Pooling
📝 How it works: A pool of server processes is maintained by Oracle in the database itself. Client connections borrow a process from the pool, use it, and return it. Similar to a middleware connection pool but built into Oracle.
📝 Covered in detail in SOP 14 — Oracle Network and Connectivity.
9.4 — Check Current Connection Model in Use
-- Check what type of server each session is using
set linesize 200
set pagesize 100
col sid       for 9999
col username  for a15
col server    for a12
col program   for a30

SELECT sid, username, server, program
FROM   v$session
WHERE  type     = 'USER'
AND    username IS NOT NULL
ORDER BY server, username;

-- server = DEDICATED, SHARED, or PSEUDO (background)
10. Oracle Data Storage Internals
10.1 — Oracle Block Structure
📝 What is an Oracle block? An Oracle block (also called a data block or page) is the smallest unit of I/O in Oracle. Default size is 8KB. Every read and write operation transfers at least one complete block. Each block has a specific internal structure.
ORACLE BLOCK STRUCTURE (8KB default)
─────────────────────────────────────
┌─────────────────────────────────┐
│ BLOCK HEADER                    │ ← Block address, block type, transaction slots
│ (fixed, ~100 bytes)             │
├─────────────────────────────────┤
│ TABLE DIRECTORY                 │ ← Which tables have rows in this block
├─────────────────────────────────┤
│ ROW DIRECTORY                   │ ← Pointers to where each row starts in block
├─────────────────────────────────┤
│         FREE SPACE              │ ← Available space for new rows and row growth
│                                 │
├─────────────────────────────────┤
│ ROW DATA (rows stored here)     │ ← Actual row data, most recent row first
│ Row 5: [data...]                │
│ Row 4: [data...]                │
│ Row 3: [data...]                │
│ Row 2: [data...]                │
│ Row 1: [data...]                │
└─────────────────────────────────┘

PCTFREE: Reserve this % of block for row updates (default 10%)
PCTUSED: Minimum % used before block goes back on free list (default 40%)
10.2 — Row Chaining and Row Migration
📝 Row chaining: When a single row is too large to fit in one block, it is chained across multiple blocks. Oracle must read multiple blocks to retrieve one row — performance impact.
📝 Row migration: When an UPDATE increases a row’s size beyond the free space in its current block, Oracle moves the entire row to a new block but leaves a forwarding pointer in the original block. A SELECT must read both the original block (for the pointer) and the new block (for the data) — performance impact.
-- Check for chained rows (requires table analysis first)
ANALYZE TABLE hr.employees COMPUTE STATISTICS;

SELECT num_rows, chain_cnt, avg_row_len, blocks, empty_blocks
FROM   dba_tables
WHERE  owner      = 'HR'
AND    table_name = 'EMPLOYEES';

-- High chain_cnt relative to num_rows indicates a problem
-- Fix: Export the table data, truncate, and reimport
-- OR: ALTER TABLE ... MOVE (reorganizes blocks)
10.3 — High Water Mark (HWM)
📝 What is HWM? The High Water Mark is the boundary in a segment that marks the highest point of data that has ever been written. Full Table Scans read ALL blocks up to the HWM — even empty blocks where rows have been deleted.
📝 Why is HWM important? If you delete 90% of rows in a table without truncating, the HWM stays high. Full table scans still read all the empty blocks up to the HWM — just as slow as before the delete. TRUNCATE resets the HWM to zero. DELETE does not.
-- Check HWM and actual space usage for a table
set linesize 200
set pagesize 50
col owner       for a15
col table_name  for a30
col total_blocks for 9999999
col used_blocks  for 9999999
col empty_blocks for 9999999
col wasted_pct   for 999.99

SELECT owner,
       table_name,
       blocks          total_blocks,
       num_rows,
       empty_blocks,
       ROUND(empty_blocks*100/NULLIF(blocks,0),2) wasted_pct
FROM   dba_tables
WHERE  owner      = 'HR'
ORDER BY wasted_pct DESC;

-- Reclaim space below HWM (reorganizes table, resets HWM)
-- This requires additional free space equal to table size
-- ALTER TABLE hr.employees MOVE;
-- Then rebuild indexes (MOVE invalidates indexes):
-- ALTER INDEX hr.emp_emp_id_pk REBUILD;
11. Redo and Undo Architecture Together
📝 Redo and Undo work together as Oracle’s ACID compliance mechanism. Understanding both together is critical.
SESSION changes a row (UPDATE employees SET salary=6000 WHERE id=100):

BEFORE THE CHANGE:
  Row in EMPLOYEES table: id=100, salary=5000

DURING THE CHANGE:
  Step 1: Read block containing id=100 into buffer cache
  Step 2: Write UNDO record: "for row id=100, salary WAS 5000"
           → Written to UNDO tablespace (allows rollback and read consistency)
  Step 3: Write REDO record: "id=100, salary NOW 6000"
           → Written to Redo Log Buffer (allows crash recovery)
  Step 4: Modify the row in buffer cache: salary = 6000

AFTER COMMIT:
  → LGWR flushes Redo Log Buffer to redo log file (DURABLE)
  → Session's locks released
  → Undo data kept for UNDO_RETENTION seconds (for read consistency of other queries)

AFTER ROLLBACK:
  → Oracle reads UNDO record and reverses the change
  → salary goes back to 5000
  → Redo records for the rolled-back transaction are also written
    (redo records the rollback itself -- so it can be replayed after crash)

AFTER CRASH (before commit):
  → At next startup, SMON runs instance recovery
  → SMON reads redo log and rolls FORWARD all changes (including uncommitted)
  → Then SMON reads undo and rolls BACK all uncommitted transactions
12. CDB and PDB Architecture (19c Standard)
📝 What is CDB/PDB? Oracle 12c introduced the Multitenant architecture. A Container Database (CDB) is an Oracle instance that can host multiple Pluggable Databases (PDBs). Each PDB appears as an independent database to applications but they all share the CDB’s SGA, background processes, and redo logs. This reduces overhead significantly when managing many databases.
CDB (Container Database)
├── CDB$ROOT (Root Container)
│   ├── System tablespaces (SYSTEM, SYSAUX, UNDO, TEMP)
│   ├── Common users (C## prefix)
│   ├── Shared SGA and background processes
│   └── Shared redo logs
│
├── PDB$SEED (Seed PDB — read-only template for new PDBs)
│
├── PDB1 (Pluggable Database 1 — Production App)
│   ├── Own SYSTEM, SYSAUX tablespaces
│   ├── Own application tablespaces
│   ├── Local users (no C## prefix)
│   └── Own service name for client connections
│
└── PDB2 (Pluggable Database 2 — HR System)
    ├── Own SYSTEM, SYSAUX tablespaces
    ├── Own application tablespaces
    └── Own service name for client connections
-- Check if this is a CDB
SELECT cdb, con_id, name FROM v$database;
-- List all containers (root + PDBs)
set linesize 200
set pagesize 100
col name for a20
col open_mode for a15
col status for a12
SELECT con_id, name, open_mode, restricted
FROM v$pdbs
ORDER BY con_id;
-- Switch to a specific PDB
ALTER SESSION SET CONTAINER = PDB1;
-- Switch back to root
ALTER SESSION SET CONTAINER = CDB$ROOT;
-- Check which container you are in
SELECT sys_context('USERENV','CON_NAME') current_container FROM dual;13. Architecture Diagnostic Queries (Daily Use)
📝 Use these queries as a quick architecture health check. They combine all the architectural concepts covered in this SOP.
13.1 — Complete Instance Health Snapshot
sqlplus / as sysdba

-- ===== INSTANCE OVERVIEW =====
set linesize 200
set pagesize 50
col instance_name for a15
col host_name     for a25
col version_full  for a20
col status        for a12
col startup_time  for a25

SELECT instance_name, host_name, version_full, status,
       TO_CHAR(startup_time,'YYYY-MM-DD HH24:MI:SS') startup_time,
       ROUND((SYSDATE-startup_time)*24,1) uptime_hours
FROM   v$instance;

-- ===== DATABASE OVERVIEW =====
set linesize 200
col name           for a12
col db_unique_name for a20
col open_mode      for a15
col log_mode       for a15
col database_role  for a20

SELECT name, db_unique_name, open_mode, log_mode, database_role
FROM   v$database;

-- ===== SGA SUMMARY =====
set linesize 200
col name     for a30
col value_mb for 9999999.99

SELECT name, ROUND(value/1024/1024,2) value_mb
FROM   v$sga
ORDER BY value DESC;

-- ===== MEMORY PARAMETERS =====
set linesize 200
col name  for a35
col value for a20

SELECT name, value
FROM   v$parameter
WHERE  name IN (
    'sga_target','pga_aggregate_target',
    'db_cache_size','shared_pool_size',
    'log_buffer','large_pool_size'
)
ORDER BY name;

-- ===== ACTIVE BACKGROUND PROCESSES =====
set linesize 200
col pname       for a10
col description for a60

SELECT b.name pname, b.description
FROM   v$bgprocess b
WHERE  b.paddr != '00'
ORDER BY b.name;

-- ===== CURRENT REDO LOG STATUS =====
set linesize 200
col l#     for 999
col status for a12
col member for a60

SELECT l.group# l#, l.sequence#,
       l.bytes/1024/1024 size_mb,
       l.status, l.archived, f.member
FROM   v$log l, v$logfile f
WHERE  l.group# = f.group#
ORDER BY l.group#;

-- ===== BUFFER CACHE HIT RATIO =====
SELECT ROUND(
    (1-(phy.value/NULLIF(con.value+cur.value,0)))*100,2
) buffer_cache_hit_pct
FROM   v$sysstat phy, v$sysstat con, v$sysstat cur
WHERE  phy.name='physical reads'
AND    con.name='consistent gets'
AND    cur.name='db block gets';

-- ===== CURRENT WAIT EVENTS =====
set linesize 200
col event      for a40
col wait_class for a20
col cnt        for 9999

SELECT event, wait_class, COUNT(*) cnt
FROM   v$session
WHERE  wait_class != 'Idle'
AND    type        = 'USER'
GROUP BY event, wait_class
ORDER BY cnt DESC
FETCH FIRST 10 ROWS ONLY;
13.2 — Architecture Reference Queries
-- Check all datafiles and their tablespaces
set linesize 200
set pagesize 100
col file#           for 999
col tablespace_name for a25
col size_mb         for 9999999
col autoextensible  for a5
col name            for a70

SELECT f.file#,
       t.name          tablespace_name,
       f.status,
       ROUND(f.bytes/1024/1024,2)   size_mb,
       f.autoextensible,
       f.name
FROM   v$datafile  f,
       v$tablespace t
WHERE  f.ts# = t.ts#
ORDER BY t.name, f.file#;

-- Check control file locations
SELECT name FROM v$controlfile;

-- Check parameter file in use
SELECT decode(value,NULL,'PFILE','SPFILE') type, value
FROM   v$parameter WHERE name = 'spfile';

-- Check archive log mode
SELECT log_mode FROM v$database;

-- Check if HugePages is configured (important for large SGA)
-- (Run as root on OS level)
-- grep HugePages /proc/meminfo
14. Architecture Quick Reference Card
| Concept | Key Fact | Check Command |
|---|---|---|
| Instance vs Database | Instance = RAM + processes. Database = files on disk | SELECT status FROM v$instance; SELECT open_mode FROM v$database; |
| SGA | Shared memory for all sessions | SELECT name,value/1024/1024 mb FROM v$sga; |
| Buffer Cache | Cached data blocks. Target hit ratio >95% | SELECT (1-phy.value/(con.value+cur.value))*100 FROM v$sysstat... |
| Shared Pool | SQL cache + dictionary cache. Target hit >99% | SELECT gethitratio FROM v$librarycache WHERE namespace='SQL AREA'; |
| Redo Log Buffer | Temporary redo before LGWR writes to disk | SHOW PARAMETER log_buffer; |
| Large Pool | RMAN, shared server, parallel query memory | SELECT bytes/1024/1024 FROM v$sgastat WHERE name='free memory' AND pool='large pool'; |
| PGA | Private memory per session for sorts and joins | SELECT value FROM v$pgastat WHERE name='total PGA allocated'; |
| PMON | Cleans up dead sessions, registers with listener | ps -ef | grep ora_pmon |
| SMON | Instance recovery, free space coalescing | ps -ef | grep ora_smon |
| DBWR | Writes dirty blocks to datafiles | ps -ef | grep ora_dbw |
| LGWR | Writes redo to log files — triggered by COMMIT | ps -ef | grep ora_lgwr |
| CKPT | Updates headers at checkpoint | ps -ef | grep ora_ckpt |
| ARCn | Archives completed redo log groups | ps -ef | grep ora_arc |
| Datafile | Stores table/index data. One tablespace per file | SELECT name,status FROM v$datafile; |
| Control file | Master file — lists all other files | SELECT name FROM v$controlfile; |
| Redo log | Records all changes for crash recovery | SELECT group#,status,archived FROM v$log; |
| Archive log | Copy of redo log for point-in-time recovery | ARCHIVE LOG LIST; |
| spfile | Binary parameter file — changed by ALTER SYSTEM | SHOW PARAMETER spfile; |
| HWM | Highest point ever written — FTS reads to here | SELECT blocks,empty_blocks FROM dba_tables; |
| SCN | Oracle’s global clock — every commit gets one | SELECT current_scn FROM v$database; |
| UNDO | Before-images for rollback and read consistency | SELECT ssolderrcnt FROM v$undostat; |
| CDB | Container database hosting multiple PDBs | SELECT cdb FROM v$database; |
| PDB | Pluggable database — appears independent to apps | SELECT name,open_mode FROM v$pdbs; |
| Hard Parse | Full SQL optimization — expensive, avoid with bind vars | SELECT value FROM v$sysstat WHERE name='parse count (hard)'; |
| Soft Parse | Reuse cached SQL plan — cheap | SELECT value FROM v$sysstat WHERE name='parse count (total)'; |
| MOS Architecture | Doc ID 1523319.1 | — |
| MOS SGA/Memory | Doc ID 430473.1 | — |
| MOS Background Processes | Doc ID 1549180.1 | — |
This SOP covers everything you need to understand Oracle Database architecture from the ground up. The instance lives in RAM and the database lives on disk — always keep that distinction clear. Every DBA activity — backup, recovery, patching, performance tuning, Data Guard, RAC — makes more sense once you understand how SGA components, background processes, and physical files work together. When you see a performance problem, think about which SGA component or background process is involved. When you see a recovery scenario, think about which physical files are affected. Architecture knowledge is the foundation that makes all other DBA skills click into place.
Written by